In 'Craigslist Part 1' I demonstrated a way to use matlab to automatically search craigslist for properties with certain attributes. In this post I show how to use matlab and python to create a kml file for plotting the results in Google Earth.
Download the matlab googleearth toolbox from
here
Add google earth toolbox to path. Import search results data and get map links (location strings). Loop through each map location and string the address from the url, then geocode to obtain coordinates.
The function 'geocode' writes and executes a python script to geocode the addresses (turn the address strings into longitude and latitude coordinates). The python module may be downloaded
here
Once we have the coordinates, we then need to get rid of nans and outliers (badly converted coordinates due to unreadable address strings). Use the google earth toolbox to build the kml file. Finally, run google earth and open the kml file using a system command:
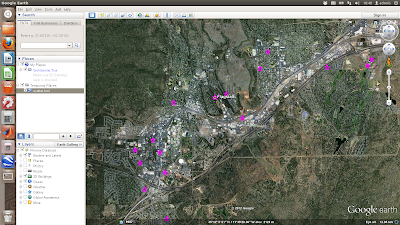
The above is a simple scatter plot which only shows the location of the properties and not any information about them. Next shows a more complicated example where the points are plotted with labels (the asking price) and text details (the google map links) in pop-up boxes
First each coordinate pair is packaged with the map and name tags. Concatenate the strings for each coordinate and make a kml file. Finally, run google earth and open the kml file using a system command:
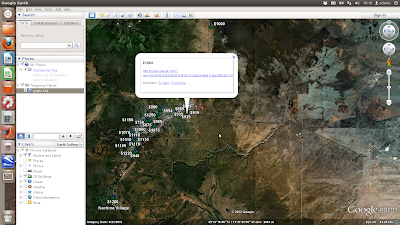
 The above is a simple scatter plot which only shows the location of the properties and not any information about them. Next shows a more complicated example where the points are plotted with labels (the asking price) and text details (the google map links) in pop-up boxes
First each coordinate pair is packaged with the map and name tags. Concatenate the strings for each coordinate and make a kml file. Finally, run google earth and open the kml file using a system command:
The above is a simple scatter plot which only shows the location of the properties and not any information about them. Next shows a more complicated example where the points are plotted with labels (the asking price) and text details (the google map links) in pop-up boxes
First each coordinate pair is packaged with the map and name tags. Concatenate the strings for each coordinate and make a kml file. Finally, run google earth and open the kml file using a system command:

No comments:
Post a Comment